A list of useful resources to understand data visualization:
* How to create effective charts and diagrams
The first step is to focus on your purpose. What do you want to show?
- Comparison
- Distribution
- Composition
- Relationship
framework by Dr. Andrew Abela to choose chart types
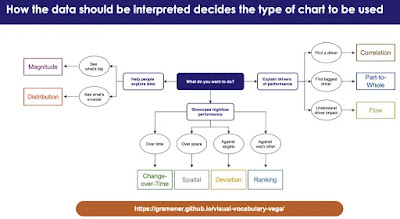
* How the data should be interpreted decides the type of chart to be used - 72 types of data visualization explored
a perspective by Gramener
* 10 Useful Ways to Visualize Your Data (With Examples) [PDF]
* Datawrapper Academy Training material
* Data visualization 'chart chooser' quick-reference guide [PDF] by Prof. Steve Franconeri
Real life examples -
* The Economist - Graphic Detail
* Through interactive data visualizations Our World in Data shows how the world is changing.
W.I.P.


0 Comments